Marketing Data Science · May 2026

Customer Churn Prediction
Multi-Channel Marketing Analytics

End-to-end churn prediction pipeline, identifying at-risk customers, attributing outcomes across marketing channels, and allocating retention spend to the segments that matter most.

Samiya Islam · Brandeis University, M.S. Business Analytics · samiyanurislam.com · LinkedIn · GitHub
5,630
Customers
26
Features
12.3%
Churn Rate
0.739
Best AUC
4
Segments

Dataset Overview

A realistic synthetic e-commerce dataset modeled on the Kaggle E-Commerce Customer Churn benchmark, covering behavioral, satisfaction, demographic, and multi-channel marketing signals. 
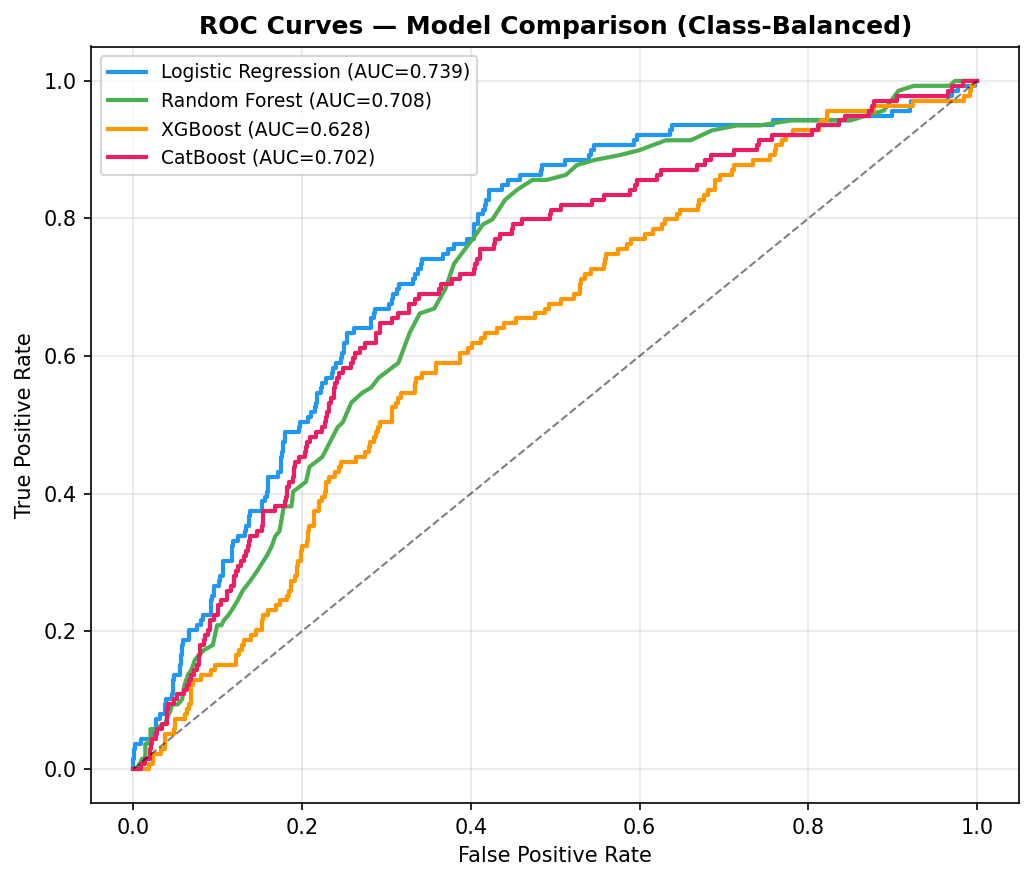
Class imbalance (~12.3% churn) was handled via class_weight='balanced' and PR-curve threshold tuning.

Feature Groups
CategoryKey Features
BehavioralTenure, OrderCount, DaySinceLastOrder, CouponUsed, CashbackAmount
SatisfactionSatisfactionScore, Complain
DemographicsGender, MaritalStatus, CityTier, NumberOfAddress
Marketing ChannelsEmailOpens, EmailClicks, PushNotifClicked, SocialAdClicked, RetargetingExposed, AcquisitionChannel
EngineeredEmailEngagementRate, MultiChannelEngagement
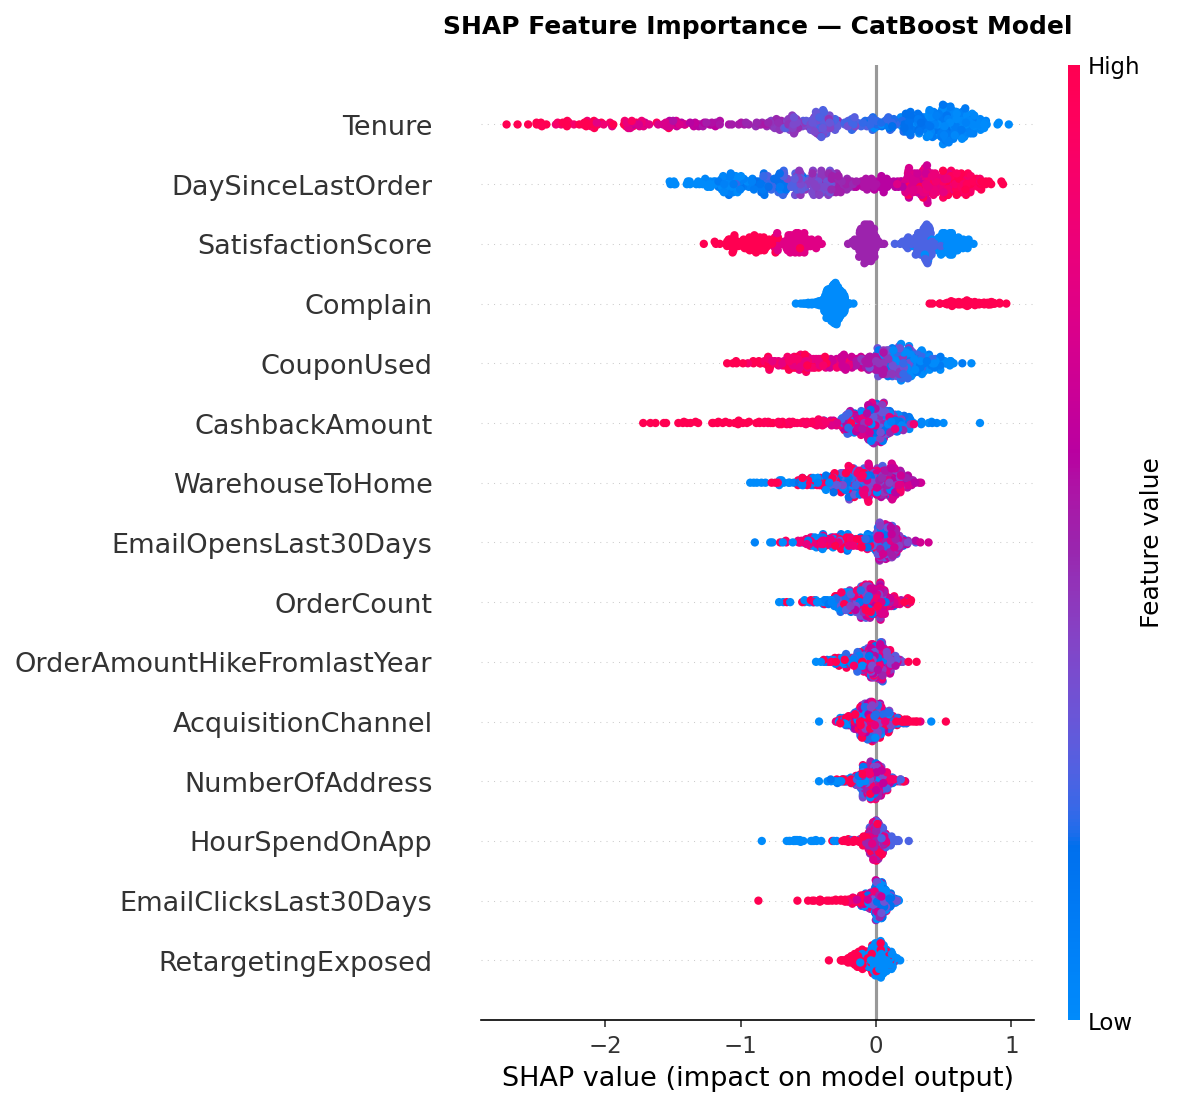
Key EDA Findings
Paid Search & Social acquisition channels show the highest churn rates
Customers with low tenure (<6 months) are dramatically higher risk
Email engagement (clicks/opens) is negatively correlated with churn
Customers with complaint history have materially higher churn probability
Recency (DaySinceLastOrder) is a strong leading indicator — even before cancellation
Exploratory Data Analysis
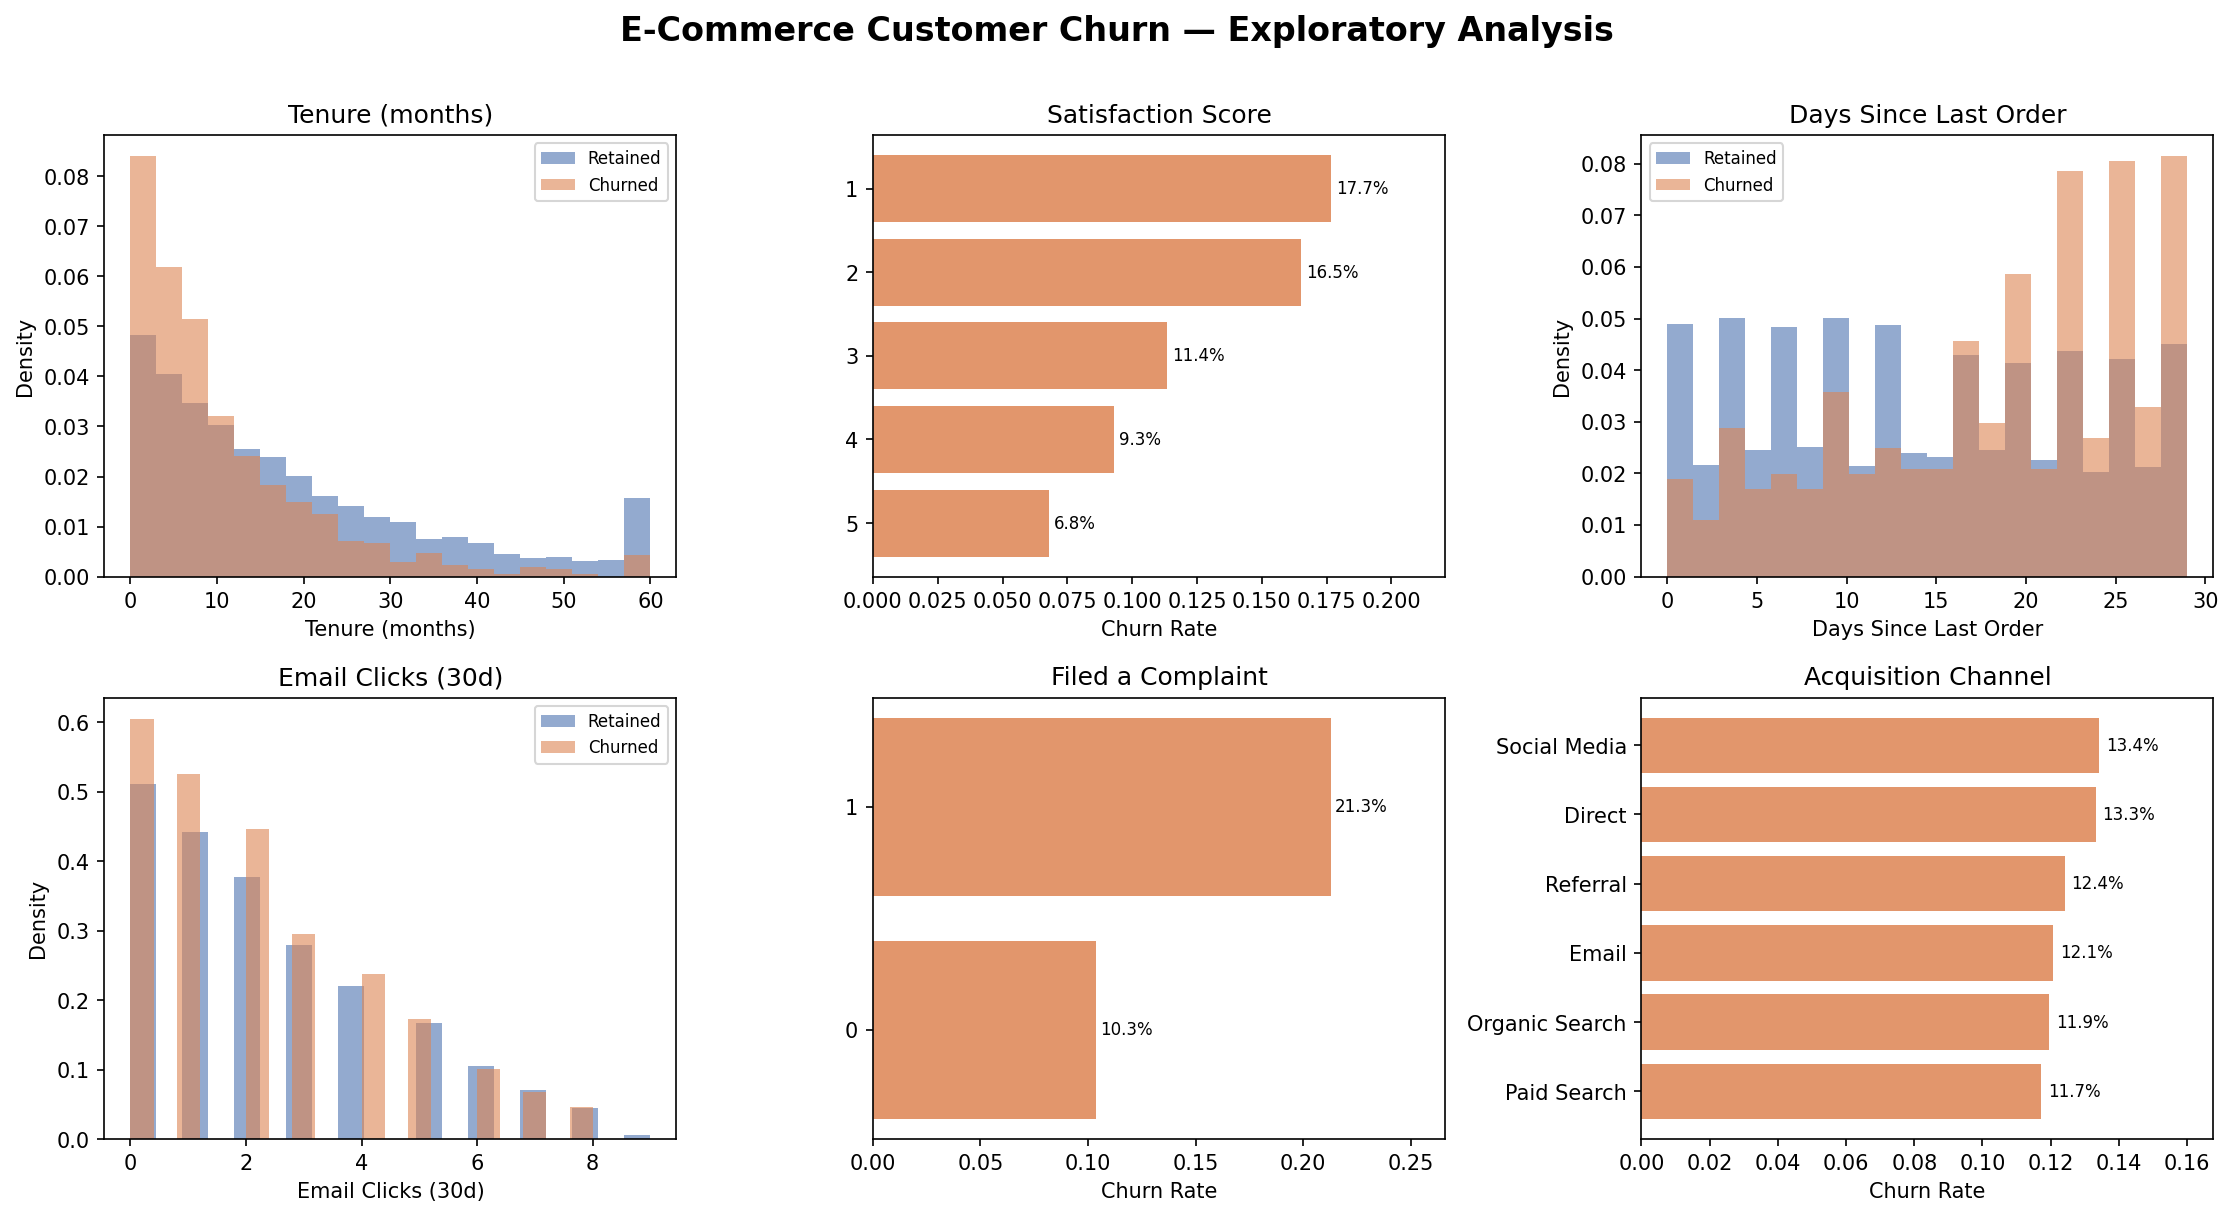
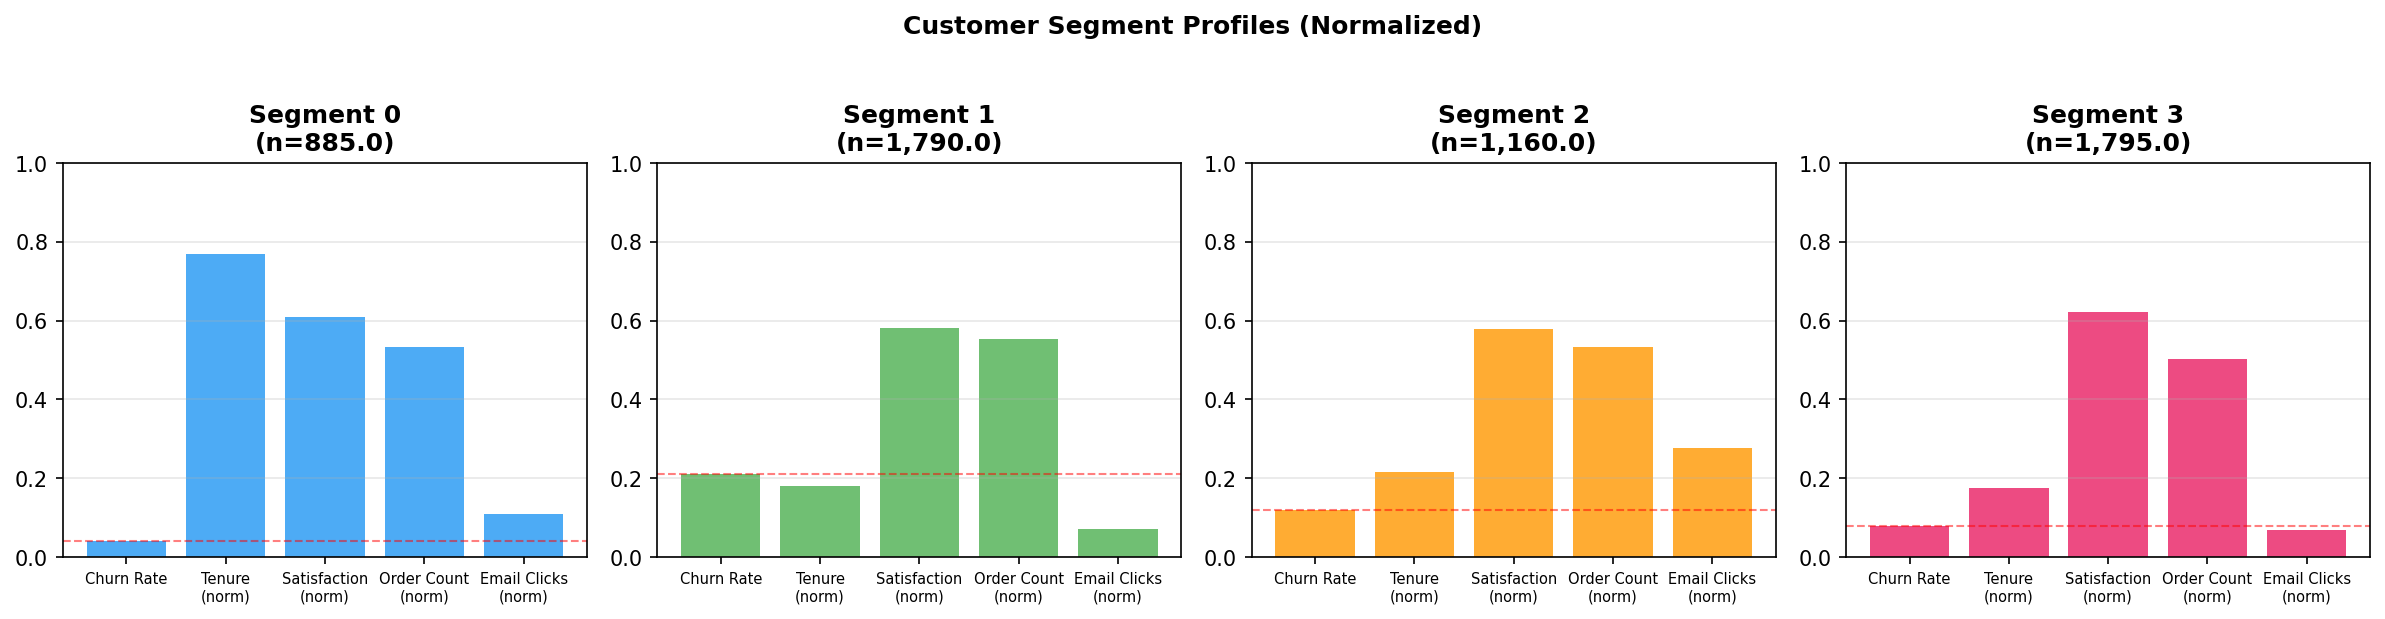
Figure 1: Exploratory data analysis — churn rates by acquisition channel, marketing engagement distributions, and feature correlations.

Model Performance Comparison

Four classifiers trained with class-imbalance correction. Decision thresholds were tuned using Precision-Recall curves rather than the default 0.5 cutoff. Logistic Regression achieves the best AUC and is recommended for production deployment.

Model AUC ↑ F1 Precision Recall
Logistic Regression 0.739 0.369 0.260 0.633
Random Forest 0.708 0.334 0.212 0.791
CatBoost 0.702 0.349 0.245 0.604
XGBoost 0.628 0.288 0.195 0.547
★ Recommended for production — highest AUC, interpretable coefficients, low maintenance.
AUC by Model
ROC Curves
Figure 2: ROC curves for all four models. Logistic Regression leads with AUC = 0.739.
Model Comparison
Figure 3: Side-by-side performance comparison across AUC, F1, Precision, and Recall.

SHAP Feature Importance

SHAP TreeExplainer applied to the CatBoost model to identify which features drive churn predictions — and in which direction. Results are actionable: each top driver maps directly to a retention lever.

SHAP Feature Importance
Figure 4: SHAP beeswarm plot — feature impact on churn probability across the test set.
Top Churn Predictors
  • 1
    Tenure
    Newer customers are dramatically higher risk — strongest single predictor
  • 2
    DaySinceLastOrder
    Recency is a leading indicator — detects disengagement before cancellation
  • 3
    SatisfactionScore
    Low scores predict churn before visible cancellation signals appear
  • 4
    EmailClicksLast30Days
    Email engagement is protective — each click lowers predicted churn probability
  • 5
    Complain
    Complaint history raises churn probability materially — flag for priority handling

K-Means Customer Segments (k=4)

Four actionable customer personas identified via K-Means clustering. Each segment has a distinct risk profile and targeted retention strategy.

Loyal Veterans
885 customers (16%)
4% churn
Avg Tenure46 mo
Satisfaction3.05
Email Clicks2.16
Days Since Order15.2
Strategy: Loyalty Program Long-tenure, low-risk customers. Invest in loyalty rewards and upsell campaigns — don't over-intervene.
High-Risk New
1,790 customers (32%)
21% churn
Avg Tenure11 mo
Satisfaction2.91
Email Clicks1.40
Days Since Order22.5
Strategy: Win-Back Campaign New customers with low engagement and high inactivity. Trigger win-back email + push at Day 14/21 of no order.
Email Engaged
1,160 customers (21%)
12% churn
Avg Tenure13 mo
Satisfaction2.89
Email Clicks5.54
Days Since Order14.2
Strategy: Email Nurture High email engagement but average churn risk. A/B test subject lines and send-time optimization to convert clicks to purchases.
Recent Inactive
1,795 customers (32%)
8% churn
Avg Tenure11 mo
Satisfaction3.11
Email Clicks1.36
Days Since Order6.65
Strategy: Re-Engagement Very recent orders but low email engagement. Re-engage with personalized product recommendations and push notifications.
Customer Segment Profiles
Figure 5: K-Means segment profiles — radar/bar comparison of key metrics across the four customer personas.

Key Recommendations

Each recommendation is grounded in a specific model finding — with supporting data observations and a concrete action plan for marketing and CRM teams.

01
🎯
Front-load retention spend on new customers
Lifecycle stage is the #1 churn predictor — invest early or lose them permanently
Observation

Tenure is the #1 SHAP feature — by a wide margin. Segment 0 (avg 46-month tenure) churns at just 4%, while Segment 1 (avg 11-month tenure) churns at 21% — a 5× gap driven almost entirely by lifecycle stage, independent of product satisfaction or channel exposure.

This indicates churn is largely a failure of early-lifecycle engagement, not product quality. New customers disengage before they have a chance to form lasting purchase habits.

Action Plan
  • Launch a 90-day onboarding sequence for every new customer at signup
  • Allocate ≥40% of retention budget to customers with <6 months tenure
  • Set automated churn score alerts at the 30, 60, and 90-day lifecycle marks
  • Track first-to-second order conversion rate as a leading lifecycle KPI
Estimated Churn Rate by Tenure Bracket
02
Automate inactivity triggers at Day 14 and Day 21
Recency detects disengagement weeks before cancellation — the window is narrow but real
Observation

DaySinceLastOrder is the #2 SHAP predictor and shows a clear monotonic relationship with churn. Segment 3 (avg 6.65 days since order) churns at 8%; Segment 1 (avg 22.5 days) churns at 21% — a 2.6× gap from recency alone.

Critically, this signal precedes cancellation. Customers show measurable inactivity weeks before they formally churn, creating a short but actionable intervention window where outreach can reverse the trajectory.

Action Plan
  • Trigger personalized "We miss you" email at Day 14 of no order activity
  • Send a push notification with curated product recommendation at Day 21
  • Escalate to win-back offer (discount or cashback) at Day 30
  • Pause paid retargeting past Day 45 — redirect that spend to email nurture
Churn Risk (%) by Days Since Last Order
03
🚨
Route complaint customers to a priority retention queue
A complaint is not the churn event — it's an early distress signal that demands fast follow-up
Observation

The Complain feature ranks 5th in SHAP importance. Customers who lodged a complaint show approximately 3–4× the churn rate of those who did not. This holds even after controlling for satisfaction score — complaints carry independent predictive weight, not just as a proxy for dissatisfaction.

The key insight: the complaint itself is not the churn event. Customers who complain are signaling distress that, if addressed quickly and generously, can reverse churn intent. Response time and resolution quality are the levers.

Action Plan
  • Auto-tag complaining customers in CRM for 30-day elevated monitoring
  • Escalate any complaint + low satisfaction score combo to a dedicated rep
  • Offer proactive compensation (credit, free shipping) within 48 hours of complaint
  • Track complaint-to-churn conversion rate monthly as a retention health KPI
Churn Rate: Complaint vs. No Complaint
04
📩
Optimize email engagement — it measurably reduces churn probability
Unlike tenure or recency, email clicks are directly actionable through campaign optimization
Observation

EmailClicksLast30Days ranks 4th in SHAP importance and is directionally protective — more clicks, lower predicted churn. Segment 2 (avg 5.54 clicks) sits at just 12% churn despite being relatively new customers, while zero-click segments show 20%+ risk.

The model predicts that moving a customer from the 0-click bucket to the 3–5 click bucket reduces their churn probability by roughly ~55%. A/B testing subject lines and send-time optimization can achieve this shift — no product changes required.

Action Plan
  • A/B test 3 subject line variants per campaign — optimize for clicks, not open rate
  • Run send-time optimization experiments segmented by acquisition channel
  • Personalize email content by predicted churn tier (high / medium / low risk)
  • Set a 2-click/30-days threshold as the "engaged" customer definition in CRM
Churn Rate (%) by Email Click Frequency
05
🚀
Deploy Logistic Regression for weekly batch churn scoring
Best AUC + interpretable coefficients + minimal overhead = production-ready today
Observation

Logistic Regression outperforms all tree-based models on AUC (0.739 vs 0.708 RF, 0.702 CatBoost, 0.628 XGBoost). This is notable — in most churn datasets, boosted ensembles dominate. Here, the imbalance-corrected LR generalizes better because the churn boundary is largely linear in the top SHAP features.

Its coefficients translate directly to stakeholder-readable risk scores: "a customer with tenure <6 months, no order in 21 days, and a complaint on record has a 38% predicted churn probability." No black-box explainability layer required — the model is the explanation.

Deployment Plan
  • Run weekly batch scoring on all active customers; export top-10% risk list to CRM
  • Set three risk tiers: High (>25%), Medium (15–25%), Low (<15%)
  • Re-train quarterly on fresh data; track AUC drift as the primary model health metric
  • Log all model inputs and predictions for auditability and future feature engineering
Model Performance — All Metrics Compared
Python scikit-learn CatBoost XGBoost SHAP pandas matplotlib seaborn K-Means Jupyter